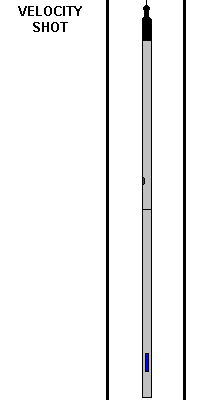
Stationary Velocity Shot - Animation and Discussion
The velocity shot method is performed while the logging tool string is stationary in the wellbore. A burst of radioactive material is released, and the gamma detector response time is recorded.
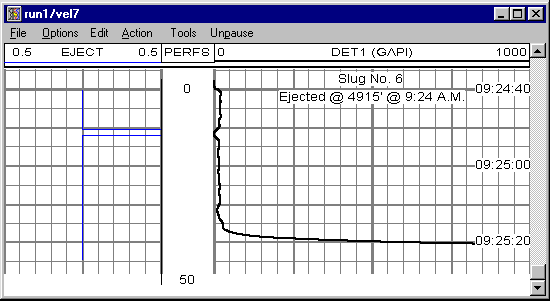
The Stationary Velocity Shot is one of the primary methods used for determining flow rates in injection wells. As shown in the animation above, a small burst of radioactive tracer material is released from the ejector tool, and the gamma detector readings are recorded versus time. In our system, the blue trace shown in track one (on the left) is indicative of the ejector tool control voltage. The ejection of radioactive material occurs about 10 seconds after recording is begun. The detector response is shown across tracks two and three, with an arbitrary scale of 0 - 1000. About 27 seconds after ejection, the radioactive material reaches the detector, and a full-scale response is recorded. So, in this example, the material takes 27 seconds to move in the flow-stream from the ejector tool to the gamma detector.
The distance that the "slug" of radioactive material moves depends on the spacing from the ejector tool to the detector. Assuming a normal tool configuration, the spacing would be five feet. So the linear velocity would be 5 feet divided by 27 seconds (5'/27s) or about 0.185 ft/sec. If the wellbore diameter is known, the linear velocity can be converted to volumetric flow rate.
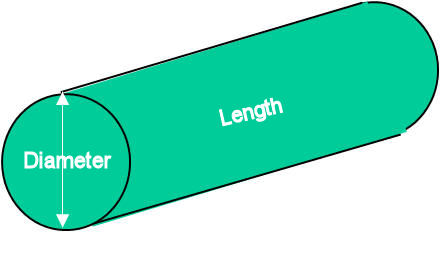
Using the velocity reaction value of 0.185 ft/sec, if the wellbore diameter is five inches, and the distance traveled by the slug of radioactive material is 5 feet, the volumetric flow rate would be calculated as follows:
П(D2/4)L/t
Where D is the wellbore diameter (in this case 5 inches) , and L is the distance traveled by the radioactive material (in this case 5 feet), and t is the time (in this case 27 seconds.) Using appropriate conversion factors, a 27 second reaction time for five foot of travel in a 5 inch pipe results in a calculated volumetric flow rate of 388 BPD. Of course, the volume occupied by the tool itself has to be accounted for, and would be in normal practice.
The profile of wellbore rates is therefore determined by positioning the logging tool string strategically in the well and determining the reaction time at various stations. From this, the injection performance of the well can be determined by calculating the losses based on the velocity profile rates.
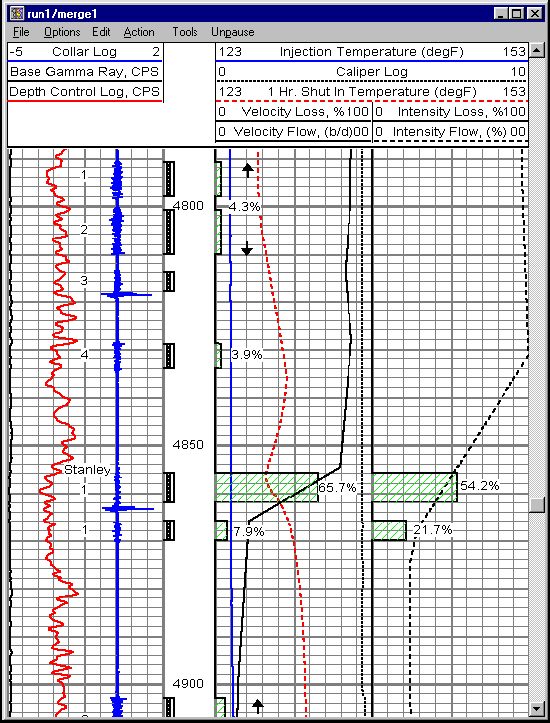
Below is an example of a final injection profile presentation. The velocity rate date can be found in the middle, in track three. The solid black line is the flow profile (BPD), and the calculated loss profile is shown as green cross-hatched bars with the loss percentages labeled. In this example, the major loss is seen to be from 4856' to 4862' and is 65.7 precent.