Intensity Profile Method
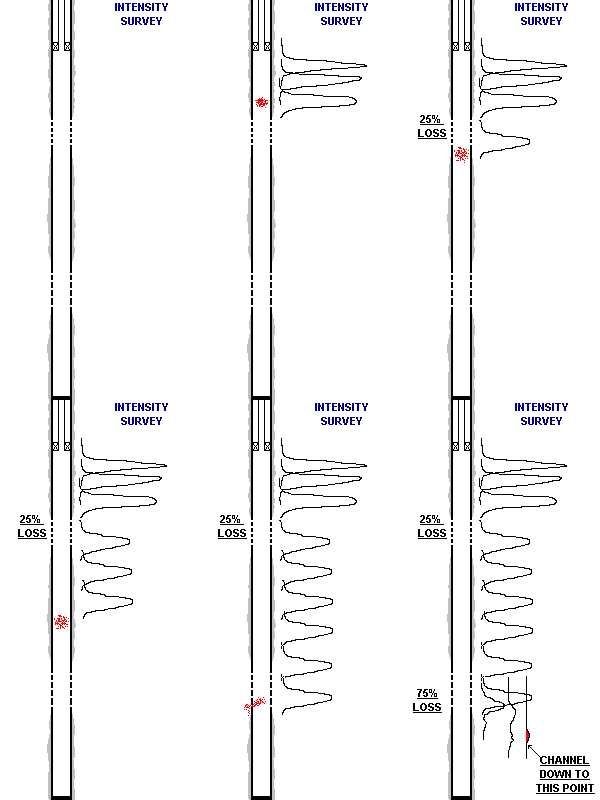
In the Intensity Profile, a single burst of radioactive material is released, and its progress is recorded as it moves down the wellbore in the flow stream.


The logging tool string is placed above the highest perforation or zone of interest. The ejector tool is motorized, and a single burst of radioactive material is released. The logging tool string then is lowered below the current position of the radioactive material in the wellbore, and then raised back up through the material as the gamma detector response is recorded. This process is repeated as often as required until the radioactive material completely exits the wellbore or area of interest.
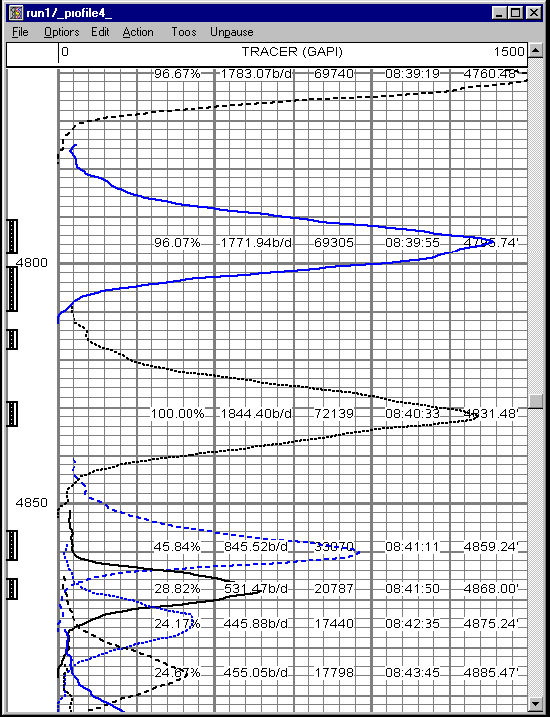
The intensity of the radioactive material is expressed as the area under the curve of the recorded gamma detector response. As shown in the log segment above, as losses in injected well fluid occur, the size of the slug decreases (area gets smaller.) By comparing the slug sizes, a percentage loss profile can be determined.
The intensity profile is a representation of the flow-loss profile. The intensity profile is not an indicator of absolute rate. When absolute rates are displayed, as in the log segment above, they are derived from the reported or measured total injection rate, and are for information purposes only. The intensity profile is only capable of determining percentage of fluid movement and loss, not absolute rates.
Another calculation can be made from the intensity profile data, by determining the location (depth) of the slug and the time when the gamma detector response is recorded. By then calculating the distance (delta wellbore depth) between each recording, and the time of recording, a linear velocity can be calculated. If the wellbore diameter is known, then the volumetric rate can be calculated, as discussed in the Stationary Velocity Shots method section of this web site. This method is termed "Tracer Timed Runs" and is another useful method for determining the injection well loss profile. Tracer timed runs are indicators of absolute injection rate, but are dependent upon accurate wellbore diameters and stable injection rates.
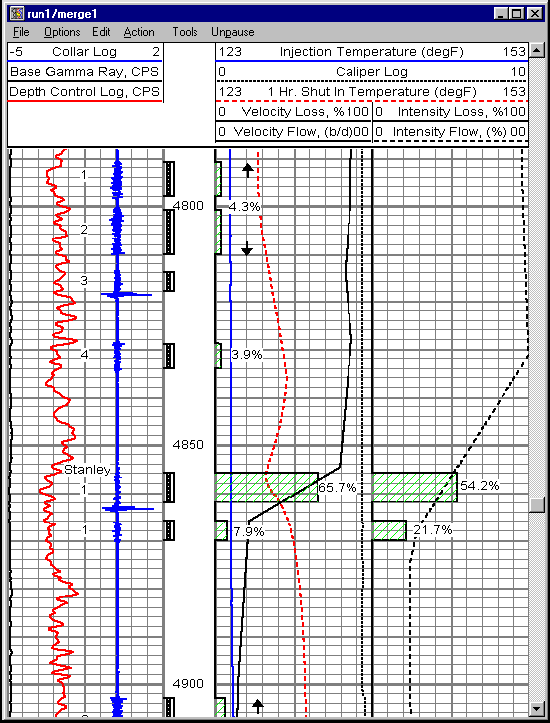
Below is an example of a final log presentation. The intensity loss profile is show in the fourth log track, with the percentage losses indicated as green crosshatched bars with the percentage values labeled.
